This week, Johannesburg will host the 2025 G20 Summit on November 22 and 23, as leaders from member economies gather to chart the course for global development. Ahead of the meeting, our visual overview maps G20 nations across three key dimensions: economic performance, environmental impact and social progress.
By plotting annual GDP growth, our chart highlights emerging markets powering ahead with strong expansions, while mature economies maintain steady but moderate gains. This dynamic snapshot shows how different growth strategies play out across regions.
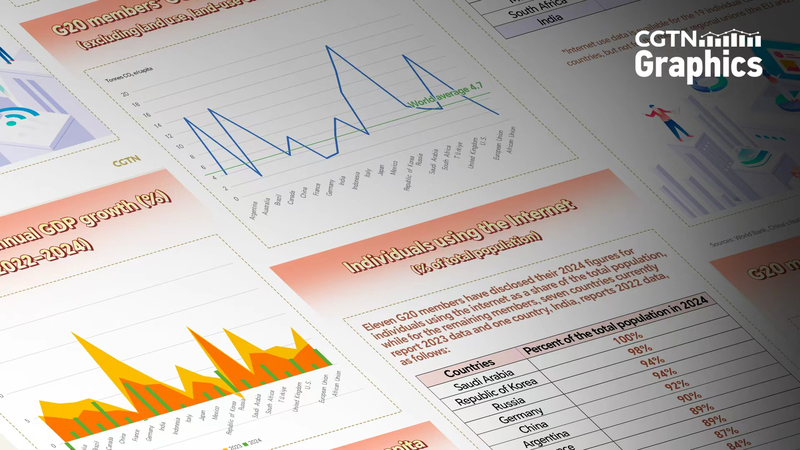
Per-capita carbon emissions trace the delicate balance between industrial output and climate targets. Some members are accelerating clean-energy shifts, while others face the challenge of reducing footprints without derailing economic momentum.
Rising internet penetration completes the picture of social development. From near-universal connectivity in advanced economies to rapid year-on-year gains in developing members, digital access is reshaping education, healthcare and entrepreneurship worldwide.
As the G20 convenes in South Africa, this graphic guide offers an objective snapshot of each member’s path—and highlights where coordinated action can drive a more inclusive, sustainable model of global development.
Reference(s):
Graphics: emerging trends in development under the G20 framework
cgtn.com